【sklearn教程】使用metrics模块评估二分类模型效果
在机器学习中,评估模型的性能非常重要,因为它可以帮助我们了解模型在不同场景下的表现如何。Scikit-learn中metrics模块是专门设计用来评估模型性能的一个模块。本文将介绍metrics模块中常用的用于评估二分类模型的函数及其使用方法。
混淆矩阵
混淆矩阵是一种常见的分类模型性能评估工具,它可以帮助我们了解模型对不同类别的分类情况。混淆矩阵通常是一个二维矩阵,其中行表示实际类别,列表示预测类别,每个单元格中记录的是实际类别与预测类别相同的样本数量。
在sklearn中,可以使用confusion_matrix函数来生成混淆矩阵。该函数的输入参数为实际标签和预测标签,输出结果为一个二维数组,其中行表示实际类别,列表示预测类别,每个单元格中记录的是实际类别与预测类别相同的样本数量。
下面是一个示例:
from sklearn.metrics import confusion_matrix

y_true = [0, 1, 1, 0, 1, 0, 0, 1, 1]
y_pred = [0, 1, 1, 0, 1, 1, 0, 1, 0]

confusion_matrix(y_true, y_pred)- 1
- 2
- 3
- 4
- 5
- 6
输出结果为:
array([[3, 1],
[1, 4]])- 1
- 2
这个混淆矩阵表示真实类别为0的样本有3个被正确预测为0,真实类别为1的样本有4个被正确预测为1,还有1个实际为0的样本被错误预测为1,1个实际为1的样本被错误预测为0。
准确率(Accuracy)
准确率是分类模型中最常用的度量标准之一。它是指模型在预测时正确分类的样本数占总样本数的比例。准确率的计算公式如下:

其中,TP表示真正例(True Positive),即模型正确预测为正例的样本数;TN表示真负例(True Negative),即模型正确预测为负例的样本数;FP表示假正例(False Positive),即模型错误地将负例预测为正例的样本数;FN表示假负例(False Negative),即模型错误地将正例预测为负例的样本数。
Scikit-learn的metrics模块中,可以使用accuracy_score函数来计算准确率。示例代码如下:
from sklearn.metrics import accuracy_score

y_true = [0, 1, 1, 0, 1, 0, 0, 1, 1]
y_pred = [0, 1, 1, 0, 1, 1, 0, 1, 0]
accuracy = accuracy_score(y_true, y_pred)
print("Accuracy: ", accuracy)- 1
- 2
- 3
- 4
- 5
- 6
输出为:
Accuracy: 0.7777777777777778- 1
精确率(Precision)和召回率(Recall)
精确率和召回率是二分类问题中常用的指标,它们分别衡量了模型在预测正例时的准确性和预测正例时的覆盖率。具体来说,精确率是指在预测为正例的样本中,真正例的比例。精确率的计算公式如下:

Scikit-learn的metrics模块中,可以使用precision_score函数来计算精确率。使用方法如下:
from sklearn.metrics import precision_score

y_true = [0, 1, 1, 0, 1, 0, 0, 1, 1]
y_pred = [0, 1, 1, 0, 1, 1, 0, 1, 0]
precision = precision_score(y_true, y_pred)
print("Precision: ", precision)- 1
- 2
- 3
- 4
- 5
- 6
输出结果为:
Precision: 0.8- 1
召回率是指在所有真实的正例中,被预测为正例的样本数占比。召回率的计算公式如下:

Scikit-learn的metrics模块中,可以使用recall_score函数来计算召回率。使用方法如下:
from sklearn.metrics import recall_score

y_true = [0, 1, 1, 0, 1, 0, 0, 1, 1]
y_pred = [0, 1, 1, 0, 1, 1, 0, 1, 0]
recall = recall_score(y_true, y_pred, average='macro')
print("Recall: ", recall)- 1
- 2
- 3
- 4
- 5
- 6
输出为:
Recall: 0.775- 1
在实际应用中,我们通常需要根据具体的场景来选择精确率和召回率的权重,比如在医学诊断中,我们可能更关注召回率,因为不想漏掉任何一个患者;而在垃圾邮件分类中,我们可能更关注精确率,因为不想让正常邮件被误判为垃圾邮件。
F1值
F1值是精确率和召回率的调和平均数,它综合了精确率和召回率的优缺点,是一个综合性的评估指标。F1值的计算公式如下:

Scikit-learn的metrics模块中,可以使用f1_score函数来计算F1值。使用方法如下:
from sklearn.metrics import f1_score

y_true = [0, 1, 1, 0, 1, 0, 0, 1, 1]
y_pred = [0, 1, 1, 0, 1, 1, 0, 1, 0]
f1 = f1_score(y_true, y_pred, average='macro')
print("F1 Score: ", f1)- 1
- 2
- 3
- 4
- 5
- 6
输出为:
F1 Score: 0.7750000000000001- 1
ROC曲线和AUC值
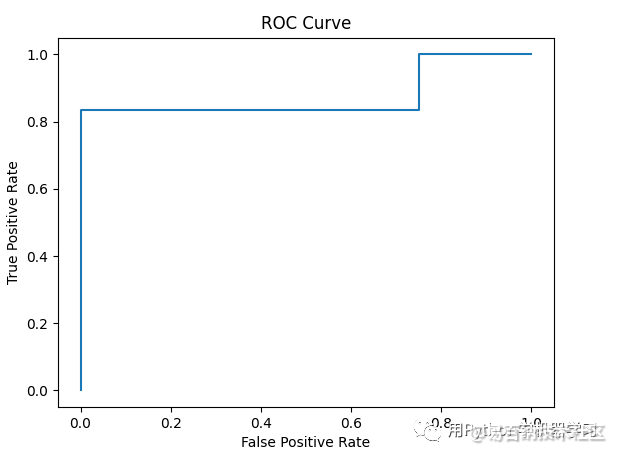
ROC曲线是一种用于评估二分类模型性能的可视化工具。ROC曲线通过计算真正例率(True Positive Rate)和假正例率(False Positive Rate)来绘制,其中真正例率是指真实正例中被正确预测为正例的比例,假正例率是指真实负例中被错误预测为正例的比例。用公式来表达,假正例率定义为:

真正例率定义为:

AUC值是ROC曲线下的面积,它是一个综合性的评估指标,AUC值越接近1,说明模型的性能越好。
Scikit-learn的metrics模块中,可以使用roc_curve函数来计算ROC曲线,使用roc_auc_score函数来计算AUC值。示例代码如下:
from sklearn.metrics import roc_curve, roc_auc_score
import matplotlib.pyplot as plt

y_true = [0, 1, 1, 0, 1, 0, 1, 0, 1, 1]
y_score = [0.1, 0.2, 0.7, 0.4, 0.6, 0.3, 0.8, 0.5, 0.9, 0.6]
fpr, tpr, thresholds = roc_curve(y_true, y_score)
auc = roc_auc_score(y_true, y_score)
print("AUC Score: ", auc)

plt.plot(fpr, tpr)
plt.xlabel('False Positive Rate')
plt.ylabel('True Positive Rate')
plt.title('ROC Curve')
plt.show()- 1
- 2
- 3
- 4
- 5
- 6
- 7
- 8
- 9
- 10
- 11
- 12
- 13
- 14
打印结果为:
AUC Score: 0.875- 1
ROC曲线为:

Scikit-learn的metrics模块使用案例
下面是一个使用Scikit-learn的metrics模块演示一个评估二分类模型性能的例子,我们的例子使用了威斯康星州乳腺癌数据集,这个数据集我们前面已经介绍过,主要使用一些细胞核特征来区分乳腺癌是良性还是恶性。我们的例子中选择了逻辑回归作为分类器:
from sklearn.datasets import load_breast_cancer
from sklearn.model_selection import train_test_split
from sklearn.linear_model import LogisticRegression
from sklearn.metrics import accuracy_score, precision_score, recall_score, f1_score, confusion_matrix

# 加载数据
cancer = load_breast_cancer()
X = cancer.data
y = cancer.target

# 划分训练集和测试集
X_train, X_test, y_train, y_test = train_test_split(X, y, test_size=0.2, random_state=42)

# 训练模型
clf = LogisticRegression(random_state=42,solver='liblinear')
clf.fit(X_train, y_train)

# 预测
y_pred = clf.predict(X_test)

# 评估模型性能
accuracy = accuracy_score(y_test, y_pred)
precision = precision_score(y_test, y_pred, average='macro')
recall = recall_score(y_test, y_pred, average='macro')
f1 = f1_score(y_test, y_pred, average='macro')
confusion = confusion_matrix(y_test, y_pred)- 1
- 2
- 3
- 4
- 5
- 6
- 7
- 8
- 9
- 10
- 11
- 12
- 13
- 14
- 15
- 16
- 17
- 18
- 19
- 20
- 21
- 22
- 23
- 24
- 25
- 26
- 27
这上面的例子中,我们使用LogisticRegression模型训练了一个分类模型,并使用Scikit-learn的metrics模块中的函数来评估测试集上模型性能。我们计算了准确率、精确率、召回率、F1值和混淆矩阵等指标,现在我们打印看一下结果:
print("Accuracy: ", accuracy)
print("Precision: ", precision)
print("Recall: ", recall)
print("F1 Score: ", f1)
print("Confusion Matrix: ")
print(confusion)- 1
- 2
- 3
- 4
- 5
- 6
结果为:
Accuracy:  0.956140350877193
Precision:  0.960472972972973
Recall:  0.9464461185718964
F1 Score:  0.9526381387619443
Confusion Matrix:
[[39  4]
[ 1 70]]- 1
- 2
- 3
- 4
- 5
- 6
- 7
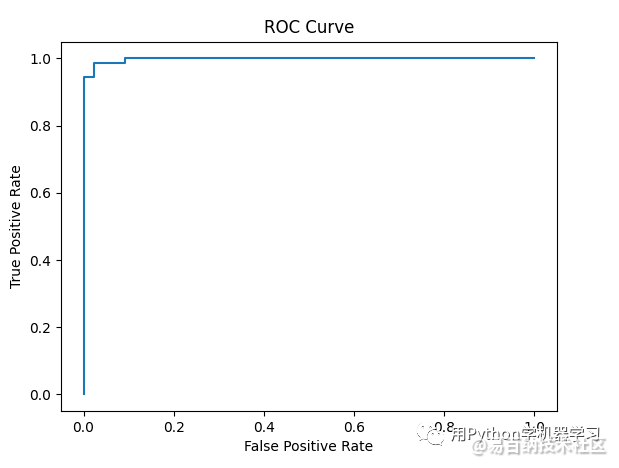
结果还是非常不错的,我们再看一下roc曲线和auc值:
y_pred2 = clf.predict_proba(X_test)[:,1]
fpr, tpr, thresholds = roc_curve(y_test, y_pred2)
auc = roc_auc_score(y_test, y_pred2)
print("AUC Score: ", auc)

plt.plot(fpr, tpr)
plt.xlabel('False Positive Rate')
plt.ylabel('True Positive Rate')
plt.title('ROC Curve')
plt.show()- 1
- 2
- 3
- 4
- 5
- 6
- 7
- 8
- 9
- 10
auc为0.998,这是一个相当好的模型。

文章转载自公众号:用Python学机器学习
- 分享
- 举报
 暂无数据
暂无数据-
浏览量:11183次2020-12-18 00:50:25
-
浏览量:5936次2021-04-14 16:24:29
-
浏览量:7991次2020-12-19 15:44:35
-
浏览量:5882次2021-02-28 15:11:37
-
浏览量:4773次2021-04-08 11:23:42
-
浏览量:882次2024-02-28 15:53:55
-
浏览量:5153次2021-04-12 16:28:50
-
浏览量:1928次2021-12-27 09:00:24
-
浏览量:157次2023-08-30 15:28:02
-
浏览量:353次2023-07-24 11:00:24
-
浏览量:5773次2021-04-20 15:43:03
-
浏览量:1289次2023-03-29 10:55:15
-
浏览量:13840次2021-06-15 10:27:34
-
浏览量:1064次2023-04-04 11:14:12
-
浏览量:5350次2021-06-07 09:28:15
-
浏览量:768次2023-07-05 10:15:58
-
浏览量:3112次2023-09-06 17:27:25
-
浏览量:254次2023-07-25 11:30:01
-
浏览量:649次2023-09-28 11:19:15
-
广告/SPAM
-
恶意灌水
-
违规内容
-
文不对题
-
重复发帖
张显显


 微信支付
微信支付举报类型
- 内容涉黄/赌/毒
- 内容侵权/抄袭
- 政治相关
- 涉嫌广告
- 侮辱谩骂
- 其他
详细说明


 微信扫码分享
 QQ好友
QQ好友


